
| Part of the footprint | What drives it | Planning use |
|---|---|---|
| Home electricity | The fuel mix of the power plant supplying you and the amount of electricity you use | Look at how your local grid is fuelled before judging your usage on its own. |
| Furnace and boiler (natural gas) | Appliance efficiency, house size and insulation, and fuel type | Treat heating as a separate line in your estimate, not as part of electricity. |
| Operational carbon | Energy consumption and waste management while people live in the house | Estimate it each year from bills; it repeats for as long as the house is used. |
| Embodied carbon | CO2 tied to the materials and construction processes used to build the home | Fixed at construction, so it matters most for new builds and major works. |
The drivers above come from the US EPA household carbon footprint calculator page and the Green Home Institute’s explainer on embodied and operational carbon.
What is the carbon footprint of a house? It is the total greenhouse gas a home is responsible for, counted in carbon dioxide equivalent, combining operating emissions from energy use with embodied carbon from construction.
This guide follows a house through its life, from construction to years of occupancy to a yearly estimate from your bills. For the wider picture, read how do homes contribute to climate change, and for the sector view see how do buildings contribute to climate change.
What the footprint measures
A carbon footprint is the total amount of greenhouse gases, including carbon dioxide and methane, linked to an activity, product or place, as The Nature Conservancy defines it. For a house, that means everything attributable to building it and running it.

Different gases trap different amounts of heat, so they are combined into one figure. As the University of Chicago’s sustainability office explains, each gas is converted into carbon dioxide equivalent and expressed in metric tons. That is why a home’s footprint is quoted in tons of CO2e rather than separately by gas.
A single average figure for “the” house is less useful than it sounds. The EPA says emissions from electricity depend on the fuel your power plant uses and how much you consume, and emissions from heating equipment depend on efficiency, house size, insulation and fuel. Two similar-looking homes can therefore land far apart, so your own estimate is the number worth having.
Phase 1: Building the house
Embodied carbon is the CO2 associated with the materials and construction processes while the home was being built, according to the Green Home Institute. It is released before anyone moves in, and it never appears on an energy bill.

This matters for two decisions. If you are buying an existing home, the embodied part is already spent, so your levers are in operation. If you are building or doing major works, material and construction choices are your only chance to influence this part, and that is when a whole-life view pays off.
Phase 2: Living in the house
Operational carbon is measured from the house’s energy consumption and waste management, per the Green Home Institute. Unlike embodied carbon, it recurs every year for as long as the home is occupied, so it is the part you can track and change over time.
Electricity
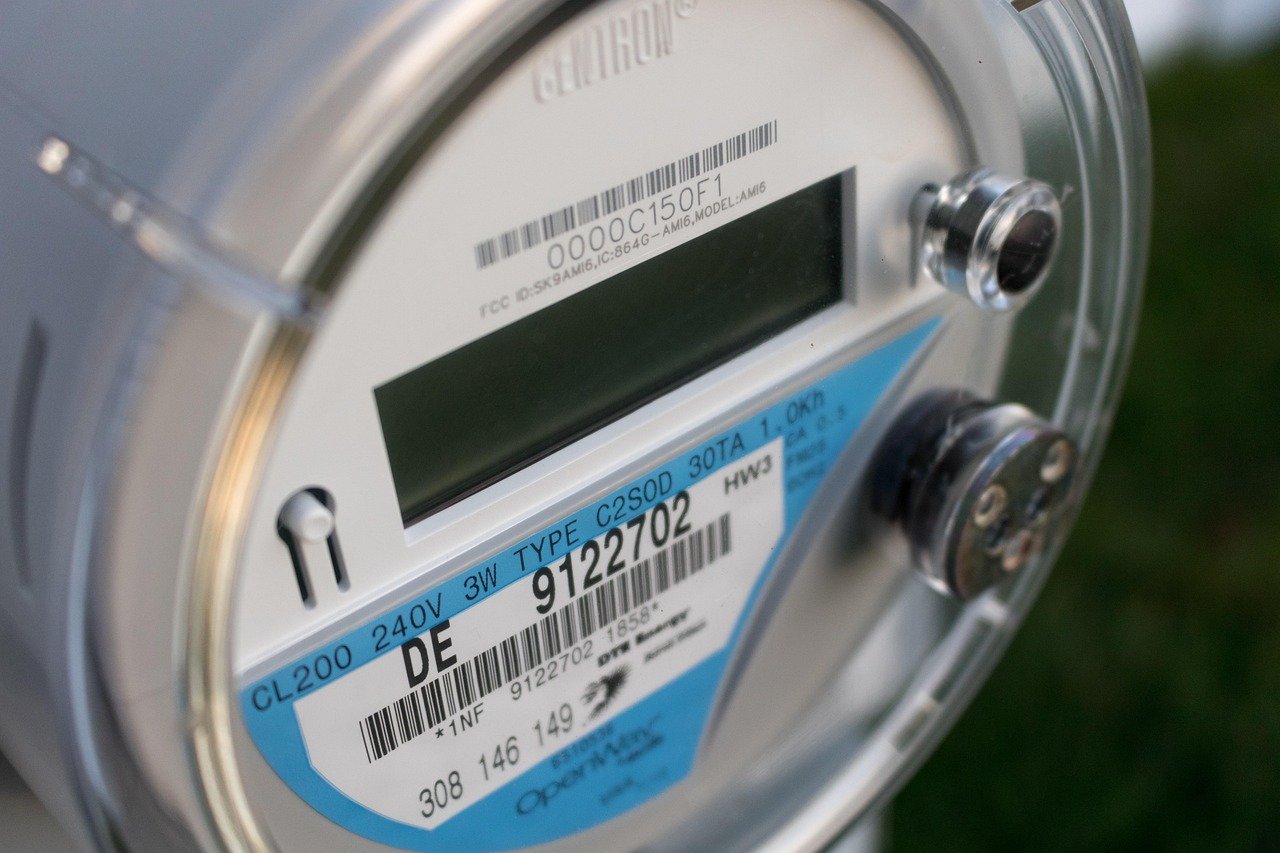
Electricity is measured in kilowatt-hours at the meter, but its emissions are not set by the meter. The EPA notes that the quantity of greenhouse gas from home electricity depends on the types of fuel your power plant uses. The conversion from kilowatt-hours to emissions uses a grid emissions factor, which reflects that fuel mix.
Heating with natural gas
Natural gas burned in a furnace or boiler releases emissions on site. The EPA states that these depend on the efficiency of the appliance, the size and insulation of the house, and the fuel type. A larger, poorly insulated house with an inefficient boiler carries a heavier heating line than a compact, well-insulated one, even with identical thermostat settings.
For many homes with gas heating, this is the line to examine first, because it is a direct fuel burn rather than something mediated by the grid. Whether it outweighs electricity in your case depends on your climate, your house and your grid, which is why the estimate below is worth doing.
Phase 3: Estimating your footprint from bills
The quickest route is the EPA Household Carbon Footprint Calculator, which estimates annual greenhouse gas emissions. To understand what it does, or to check it by hand, follow the same logic with your own bills.
- Collect a full year of bills. A full cycle captures both heating and cooling seasons, so the estimate is not skewed by one unusually cold or mild stretch.
- Total each fuel separately. Add electricity in kilowatt-hours and gas in whatever unit the bill uses. Do not mix fuels at this stage.
- Match each fuel to an emission factor. For electricity, use a factor for your local grid; for gas, use the factor for natural gas. Government agencies publish these, and the EPA calculator applies them for you.
- Multiply usage by factor. The worked pattern is simply electricity used times the grid factor, plus gas used times the gas factor, each result expressed in CO2e.
- Add the lines together. The sum is your annual operating footprint in metric tons of CO2e, and the split between lines shows where it comes from.

When the result looks off
- Gas missing. If you used only electricity bills, you have left out furnace or boiler emissions, which the EPA treats as a separate source.
- Waste ignored. Operational carbon also covers waste management, which does not come from an energy bill, so a bills-only figure is a partial view of the operating total.
- Construction absent. Bills never capture embodied carbon, so a low yearly figure does not mean the whole-life footprint is low.
- Wrong grid. Applying a factor from another region will mislead you, since the factor follows the power plant fuel mix.
Why the same house differs by region
Because the grid factor follows the fuel mix of the power plant, an identical house using the same kilowatt-hours produces different electricity emissions in different places. The EPA makes this point directly: emissions from home electricity depend on the types of fuel your power plant uses.
Heating compounds the difference. Efficiency, house size, insulation and fuel type all shift the furnace and boiler line, and climate changes how much heating is needed at all. So compare homes only after you have applied local factors, and compare your own year to the next one rather than to a national figure.
Putting the whole life together
A life cycle assessment evaluates a building’s full carbon footprint, covering operations and embodied carbon, according to the Green Home Institute. Use it as the frame when weighing a build or major renovation: a choice that lowers operating emissions but adds heavily to embodied carbon needs both sides counted.
For an existing home, the practical starting point is the yearly bill estimate above, then a look at which line is largest.
Frequently asked questions
What is the carbon footprint of an average house?
It varies with the grid fuel mix, heating fuel, appliance efficiency, house size and insulation. The EPA household calculator gives an annual estimate for your own situation, which is more reliable than a generic average.
Which sources contribute most to household emissions?
Home electricity and furnace or boiler fuel are the main operating sources the EPA identifies. Which is larger depends on your grid and heating system. Waste management and construction materials add further parts.
What is the difference between operational and embodied carbon?
Embodied carbon is the CO2 from materials and construction when the home was built. Operational carbon comes from energy consumption and waste management while the home is lived in.
How much CO2 does a house produce?
Emissions are expressed as metric tons of carbon dioxide equivalent, combining all greenhouse gases. The amount depends on energy use, fuel type and your local grid, so calculate it from your own bills.