| Symptom | First action | Planning use |
|---|---|---|
| Home sits near a river, the coast or low ground | Look up the address on FEMA flood maps and note the flood zone | Shows whether the area is designated as high flood risk |
| Home backs onto wildland or dense vegetation | Open a wildfire hazard map and locate the address | Shows how exposed the surroundings are to fire |
| Summers already feel dangerously hot | Read the heat rating in a free property climate report | Compares future heat with a historical baseline |
| Two tools give different answers | Compare each tool’s scale, time horizon and data resolution | Explains the gap before it drives a decision |
| Water pools on the street after rain | Walk the lot and note low points and drains | Adds detail that area-level scores may miss |
| Buying and want a single summary | Run a free climate risk report on the address | Gives a rated overview of several hazards to discuss with an agent or inspector |
The table draws on ClimateCheck’s flood guidance and RPR’s description of ClimateCheck property ratings.
Learn how to check climate risk for a house by looking up its address in a FEMA flood map, a wildfire hazard map and a free property climate report, then comparing what each one shows.
This guide covers the lookup workflow. The wider picture, including how do homes contribute to climate change, sits in the home climate impact hub. The hazards behind the results are explained in a guide on how does climate change affect homes.
The lookup workflow in order
You need only a full street address and a few minutes per tool. The outcome is a short record of flood, fire and heat findings for one property, plus a list of questions that no online tool can answer.
- Start with the flood map. Enter the address in FEMA’s flood maps and write down the zone shown.
- Move to wildfire. Find the address on a wildfire hazard map and note how close it is to wildland.
- Run a property climate report. Use a free report to see heat, flood, storm, drought and fire ratings side by side.
- Compare the methods. Check the scale, time horizon and resolution behind each rating before treating differences as contradictions.
- Verify on the ground. Walk the street and the lot, then raise anything unclear with an inspector or agent.
Each step answers a different question, so skipping one leaves a gap that another tool will not fill. The flood check comes first because it is the most address-specific.
Check flood risk with FEMA maps and property ratings
FEMA publishes flood maps that give information about local flood risks, and ClimateCheck describes its property report and the FEMA maps as powerful tools for assessing specific flood risk. For anyone looking for a free climate risk map for a property, the FEMA map is the natural first stop.
What a flood zone designation means
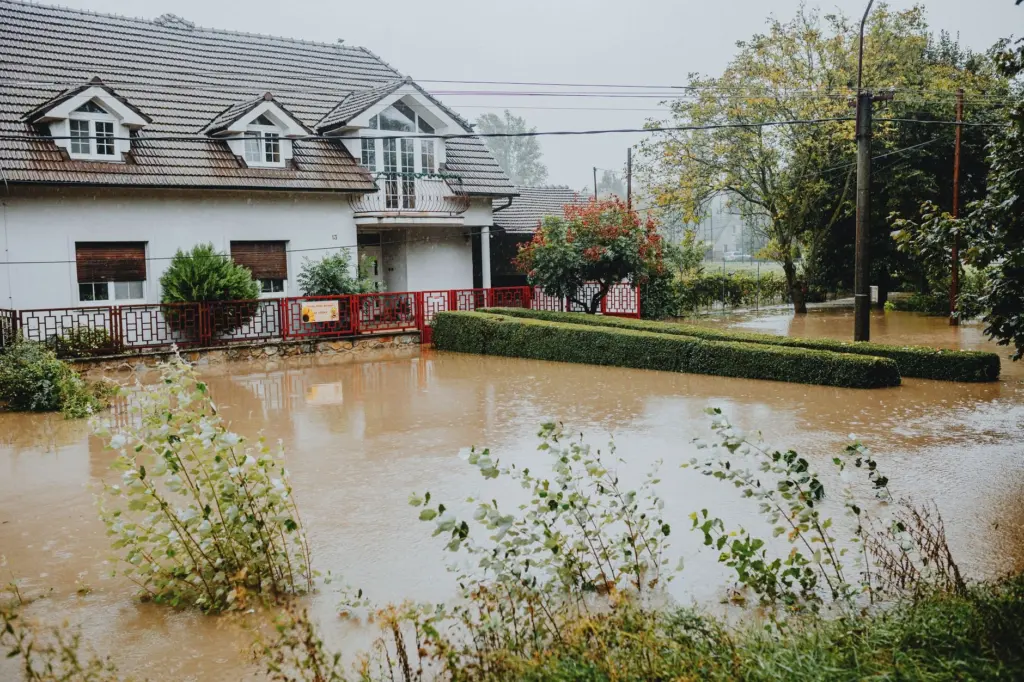
Flood zones are geographic areas that FEMA has designated as having a high risk of floods. The designation describes an area, so treat it as a trigger for closer checking rather than a full history of the house. A property inside a designated zone deserves a property-level flood rating next. A property outside one still merits a quick look at nearby water and low ground.
Symptom to fix
- The address falls inside a flood zone: record the zone, then compare it with a property rating so you can see how the area-level designation relates to the specific house.
- The address is outside any zone but near water or low ground: look at a score that goes beyond the FEMA map. ClimateCheck’s flood ratings combine the probability and depth of four flood types: coastal, storm surge, fluvial and pluvial.
- The map and the score disagree: check how far the score reaches. For fluvial flooding, ClimateCheck uses a random forest model that extends FEMA flood risk zones across the entire U.S., so the two are related but not identical products.
- You need a time frame: RPR notes that its flood rating measures the probability of a significant flood between 2020 and 2050, which is a planning window rather than a forecast for next year.
Check wildfire exposure
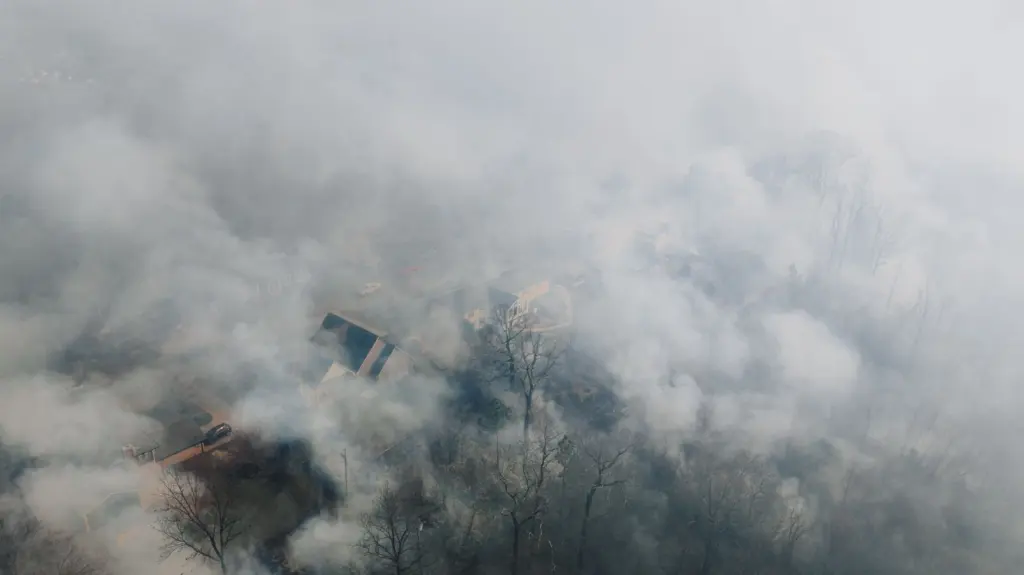
A wildfire hazard map expresses exposure as the chance that an area burns, so read it for the surroundings of the house as much as the plot itself. ClimateCheck gives one example: wildland areas near Santa Barbara, CA show up to a 45% chance of burning in a 30-year window. That figure belongs to those wildland areas and is not a typical value for other places.
- The house borders wildland or open vegetation: use the wildfire map first and read the highest value near the address, not only the pin itself.
- The house is in a built-up area away from wildland: the fire rating in a property report is usually enough for a first pass. RPR lists Fire as one of five hazards rated from 1 to 100.
- The result looks high: note it and discuss it with a local professional before drawing conclusions, because a map shows exposure and not how the individual house is built.
Read heat, storm and drought in a climate risk report
A climate risk report puts several hazards for one address on a shared scale. ClimateCheck offers a free report on its website, and RPR describes the rating as running from 1 to 100, with 100 the highest risk, looking ahead to 2050. Its snapshot covers Heat, Flood, Storm, Drought and Fire.
Heat
ClimateCheck’s heat rating compares future conditions with a baseline: historical conditions from 1980 to 2005 on the hottest 2% of days per year. Its Phoenix, AZ example is projected to go from about 7 days per year over 110ºF to about 45 days per year by 2050. A high heat rating is a prompt to look at cooling, shading and insulation, which the guide on how to protect your home from extreme heat covers.
Drought and other hazards
RPR explains that its drought analysis uses downscaled data from CMIP5 climate models under the RCP 8.5 scenario, at watershed level. That detail matters when comparing providers, because a drought score reflects the water basin around the property more than the lot itself.
Other providers publish property reports too. ERIS says its climate risk assessment aggregates and distills over 50 different climate simulations from peer-reviewed government and academic sources.
Compare scores from different providers
Climate risk scores are modelled estimates, and they differ in design. The differences below explain most disagreements between tools.
- A tool with another window will not match them.
- A score at that grain describes the surrounding area, so pair it with an address-level map and a visit to the street.
- Inputs: a climate risk mapping tool reported by Capital B combines 184 data sets to rank more than 70,000 U.S. census tracts, while the EPA’s tool is based on 20 indicators. A tool built on more indicators is not automatically more accurate, but its results will diverge from a simpler one.
The practical rule is to trust agreement and investigate disagreement. When two tools point the same way, the finding is firmer. When they split, look first at scale, window and resolution before deciding which is right.
Check the street and the lot in person
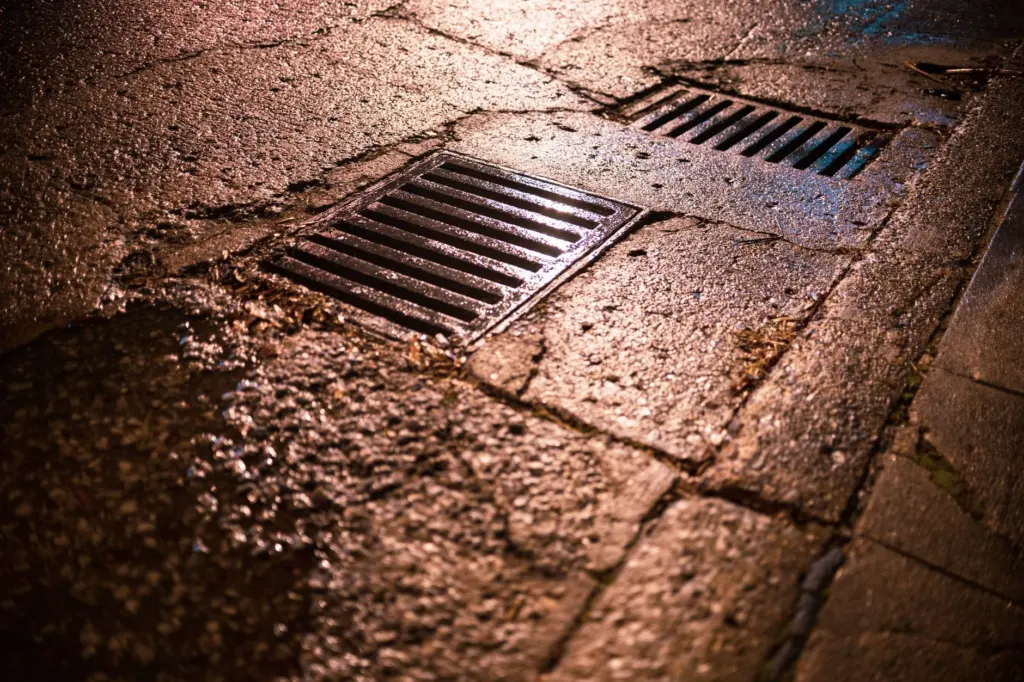
Online tools describe areas, so a short walk adds what they cannot. Look at where the street slopes and whether the house sits at the low end. Note where rainwater would run from the roof and the driveway, and whether drains and grates are present and clear of debris. If the property had a flood or fire flagged in the earlier steps, concentrate on those points.
Use a climate risk report when buying
A climate risk report for home buyers works best as a briefing document. Run the free report for each shortlisted address, keep the flood zone and the ratings together, and bring them to the viewing and the inspection. Ask the seller or agent about past water damage or fire events, and ask the inspector to look at drainage and the roof edge with those results in mind.

Stop and take advice when the flood zone, the wildfire map and the property report all flag the same address. Agreement across tools is the strongest signal the lookup can give.
Frequently asked questions
| Question | Answer |
|---|---|
| Are there free climate risk maps for a property? | Yes. FEMA publishes flood maps with local flood risk information, and ClimateCheck offers a free property report on its website. A wildfire hazard map covers fire exposure for the address. |
| What does a flood zone designation mean? | It means FEMA has designated the geographic area as having a high risk of floods. It describes the area, not the history of one building. |
| How reliable are climate risk scores? | They are useful for comparing locations, but they depend on the provider’s scale, time window and data resolution. Treat agreement between tools as the stronger signal. |
| Which hazards does a property snapshot rate? | RPR’s ClimateCheck snapshot rates Heat, Flood, Storm, Drought and Fire, each from 1 to 100. |